External monitoring endpoint
Description
The Orchestra external monitoring endpoint enables the integration of Orchestra with any external monitoring solution. It provides valuable data regarding channels, signals, and process information through exposed REST endpoints. This information can be utilized by external monitoring tools to create dashboards and trigger alerts.
Monitoring with PRTG
The external monitoring endpoint is readily compatible with the PRTG software from Paessler. This monitoring software includes integrated evaluation sensors specifically designed for Orchestra. PRTG offers a robust and user-friendly monitoring solution that facilitates the recording, storing, and evaluation of status and performance, in addition to sending alerts and publishing data in dashboards and reports. For more information about this tool, visit Paessler.
Requirements
-
An installed and executable version of Orchestra.
-
An external monitoring software.
-
A valid plugin license for unlimited functionality (the plugin is otherwise only available as a trial version). The license can be ordered by contacting licensing@soffico.de.
-
By default, the plugin is configured to use password authentication. A user is required who has the Orchestra role Remote.External.Monitor.Endpoint assigned.
Accessing the External Monitoring Endpoint
When Orchestra is started, the plugin services can be accessed at the following address:
http://<Servername/IP address>:8019/Orchestra/default/SystemMonitoringPlugin/
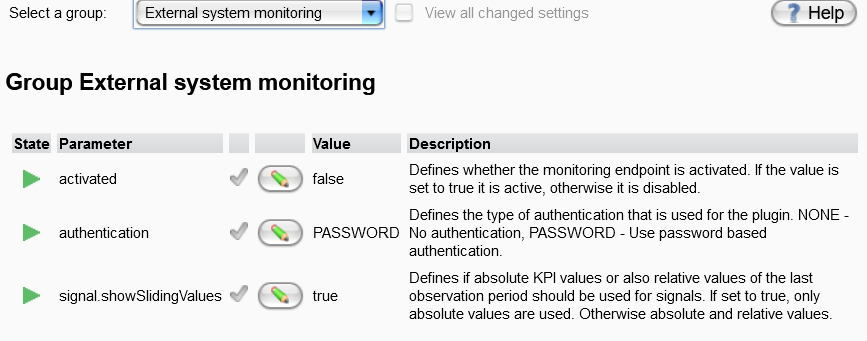
Note: The monitoring endpoint is inactive by default. It must be activated first. Activation is done within the settings found in the Orchestra monitor. Go to the group "External system monitoring" and set the parameter activate to true.
See also Edit User - assign access rights.
Settings
The settings for the external monitoring endpoint are configured in the Settings panel, under the group External system monitoring (Settings -> Environment settings -> External system monitoring).
Exported Monitoring Resources
After calling the above URL, a list of monitoring resources will be returned, each providing specific information about Orchestra. For each resource, the following attributes are returned:
| Field | Description |
|---|---|
| Name | The name of the monitoring resource. |
| Description | A human-readable description of the data and information exposed by this resource. |
| Resource | The name of the sub-resource used to construct the full URL to the resource itself. |
| URL | The absolute URL used as an entry point into the specific resource. Each resource provides detailed information about available monitoring figures and additional data through this endpoint. |
The following resources are currently exposed:
| Field | Provided Information |
|---|---|
| ChannelMonitoringInbound | Monitoring of Orchestra inbound channels. The endpoints provide the following information for every inbound channel:
|
| ChannelMonitoringOutbound | Monitoring of Orchestra outbound channels. The endpoints provide the following information for every outbound channel:
|
| ProcessMonitoringPlugin | Monitoring of process executions. The endpoints provide the following information for every process:
|
| ProcessesPerScenarioPlugin | Monitoring of process executions on a scenario level. The endpoints provide the following information for every scenario:
|
| OverallSignalMonitoringPlugin | Monitoring of signal KPIs, cumulated/grouped by the signal name. The endpoints provide the following signal information for every signal:
|
| SignalDetailedParticipationPlugin | Monitoring of signal KPIs, cumulated/grouped at the level of Process Model and signal name. The endpoints provide the following signal information for every combination of Process Model and signal:
|
| SignalPerProcessModelPlugin | Monitoring of signal KPIs, cumulated/grouped at the process model level. The endpoints provide information for all signals sent or received by a specific process model, independent of the signal type:
|
| SystemMonitoringCPU | Monitoring of CPU utilization. The endpoints provide the following information:
|
| SystemMonitoringMemory | Monitoring of memory utilization. The endpoints provide the following information:
|